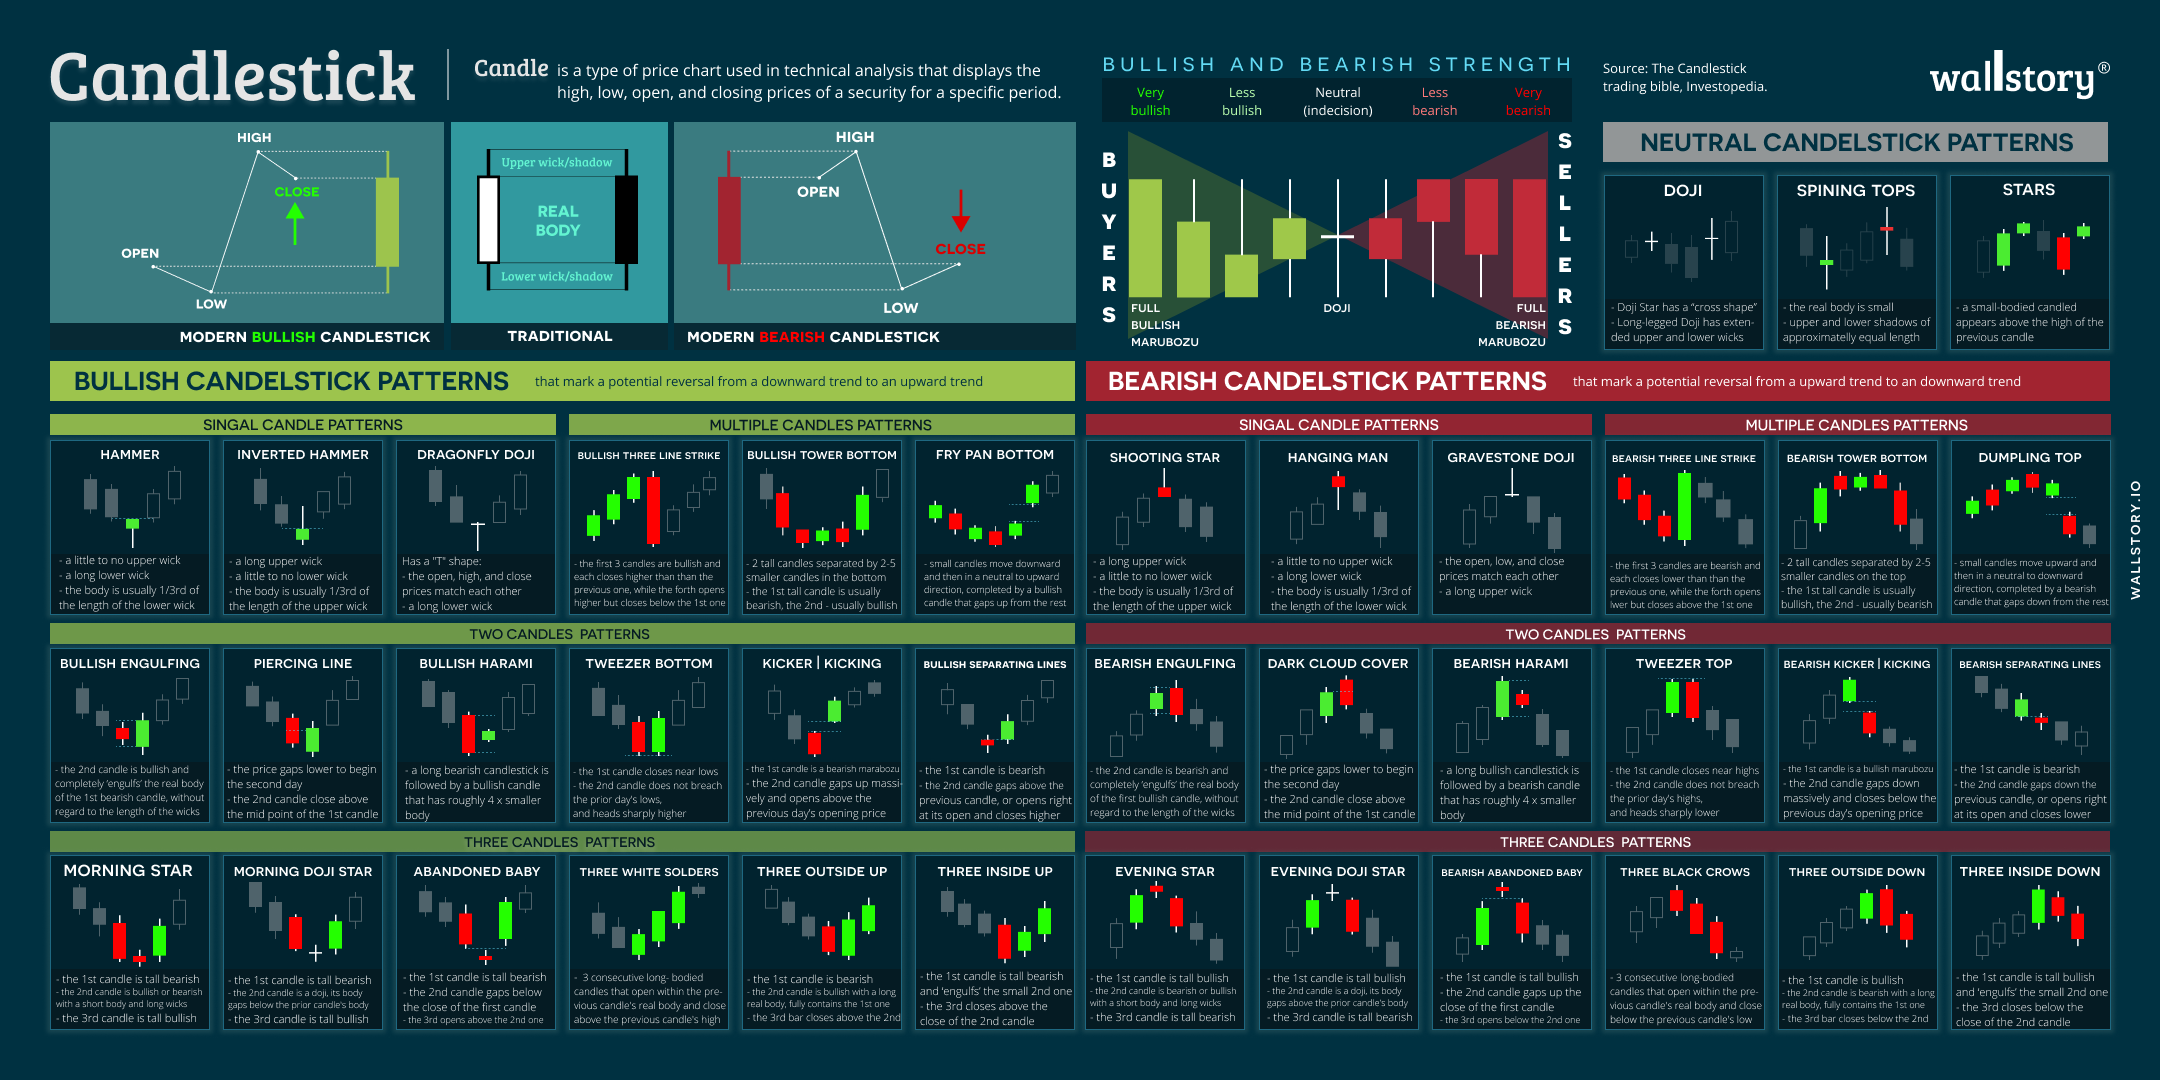
Candlestick is a type of financial chart used to represent the price movement of an asset, such as stocks, currencies, commodities, etc., over a specific period of time. It consists of four price points: the opening price, the closing price, the highest price, and the lowest price. The difference between the opening and closing prices is represented by a body, typically colored either black or white, with the upper and lower shadows indicating the high and low prices. The combination of the body and shadows provides visual information about the direction of the price movement, helping traders make informed decisions. Candlestick patterns are specific formations of candlesticks that traders use to identify potential price trends and make informed trading decisions. These patterns are created by the combination of the body, shadows, and real bodies of candlesticks over a certain period of time. Some commonly recognized candlestick patterns include the "Hammer," "Doji," "Hanging Man," "Bullish Engulfing," and "Bearish Engulfing." Each pattern has a specific meaning and provides insight into the sentiment of the market, such as bullishness or bearishness, and the potential for future price movement.


