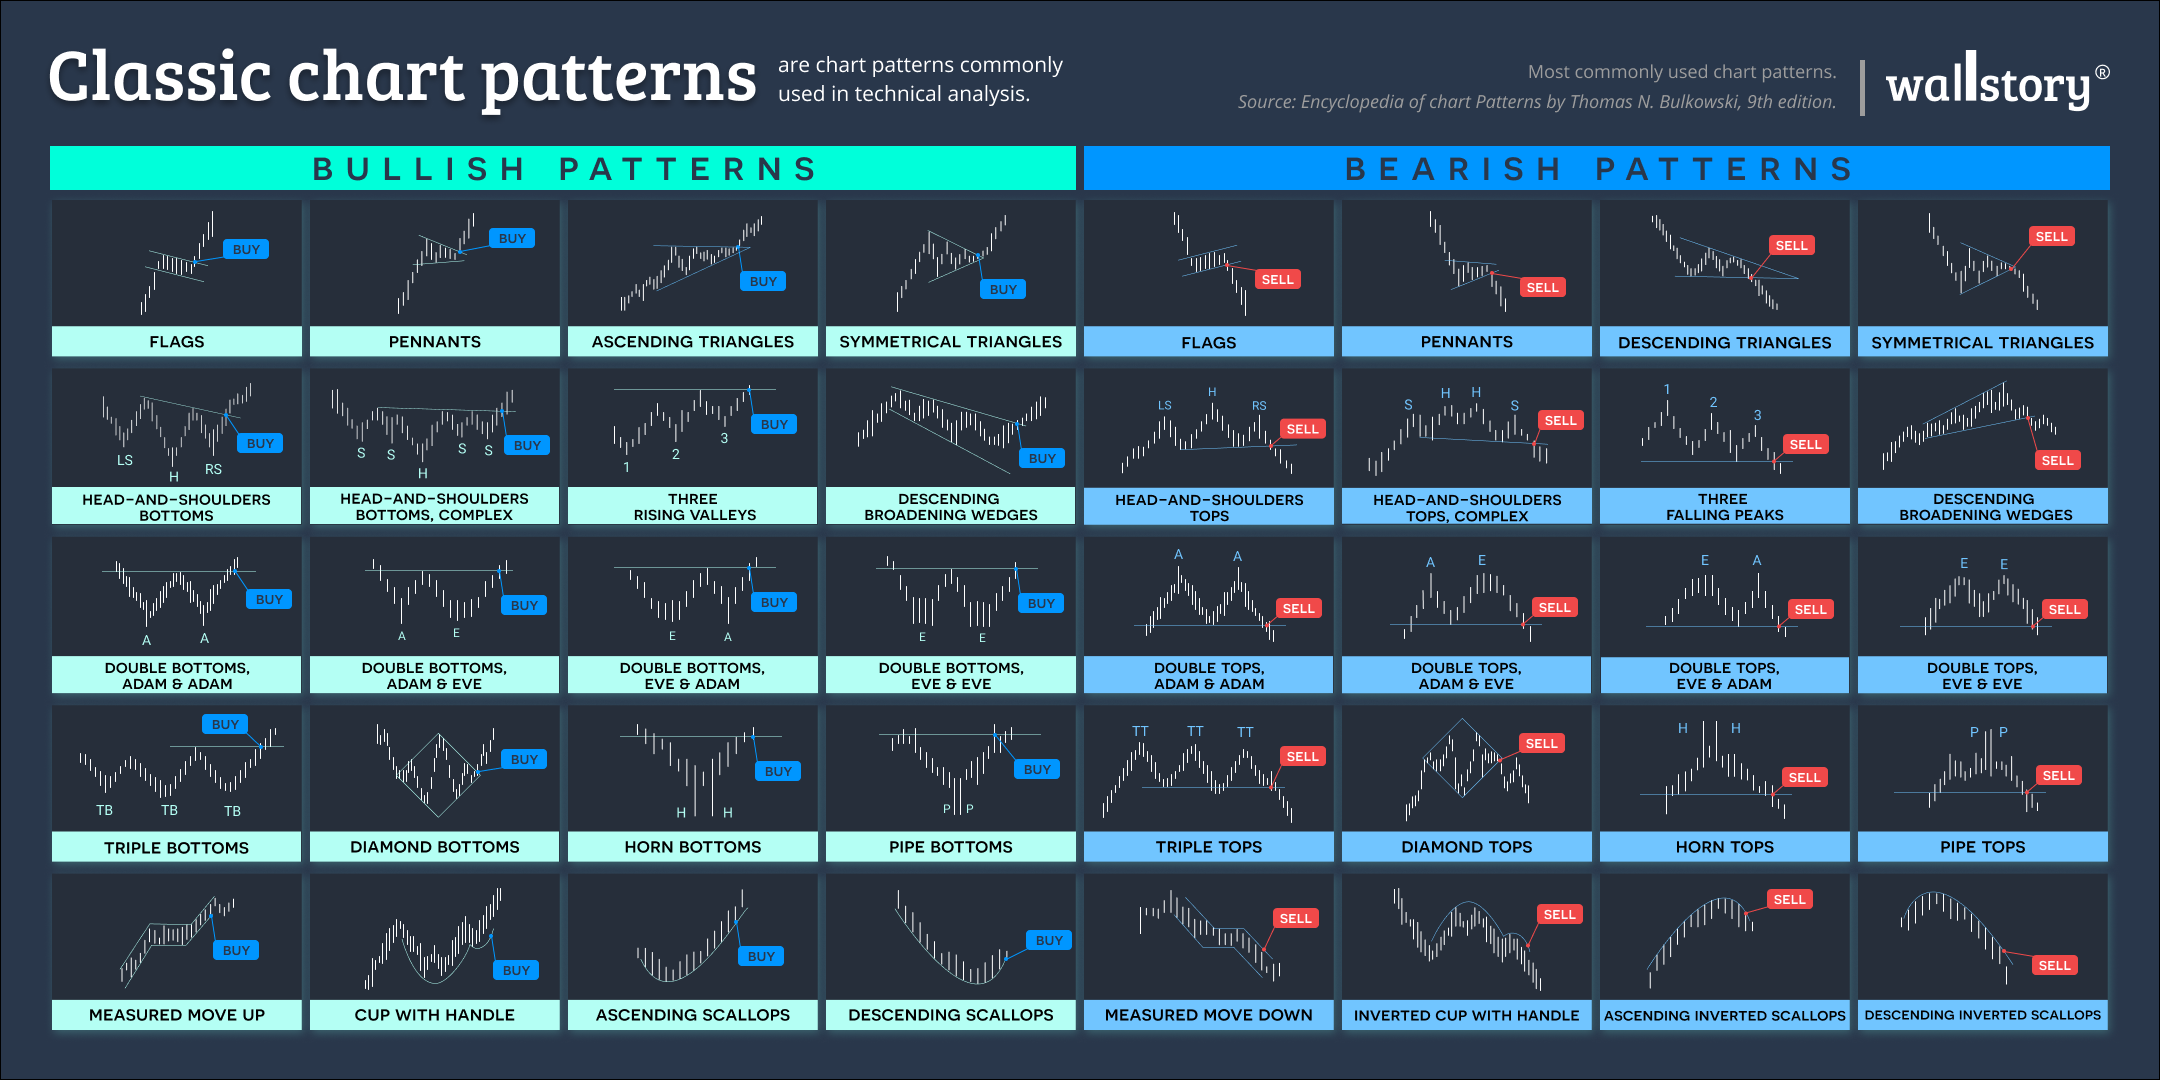
Chart patterns are recognizable patterns that occur in financial charts, and are used in technical analysis to make investment decisions. Chart patterns can provide insights into market trends and potential reversal points, and can be used to confirm existing trends or indicate the likelihood of a trend reversal. Some common chart patterns include head and shoulders, double and triple tops and bottoms, flags and pennants, and trend lines. Each pattern has its own unique characteristics, such as a certain shape or price action, and can indicate a specific type of market behavior, such as a reversal or continuation of a trend. Chart patterns can be used by traders and investors to help identify potential buying or selling opportunities. It is important to note, however, that chart patterns are just one of many technical indicators and should not be used in isolation when making investment decisions. They should be used in conjunction with other technical analysis tools and with fundamental analysis of a company's financials, management, and market position. Additionally, chart patterns are subject to interpretation and can be subject to false signals, so it is important to have a clear understanding of the pattern and its implications before making any investment decisions.


