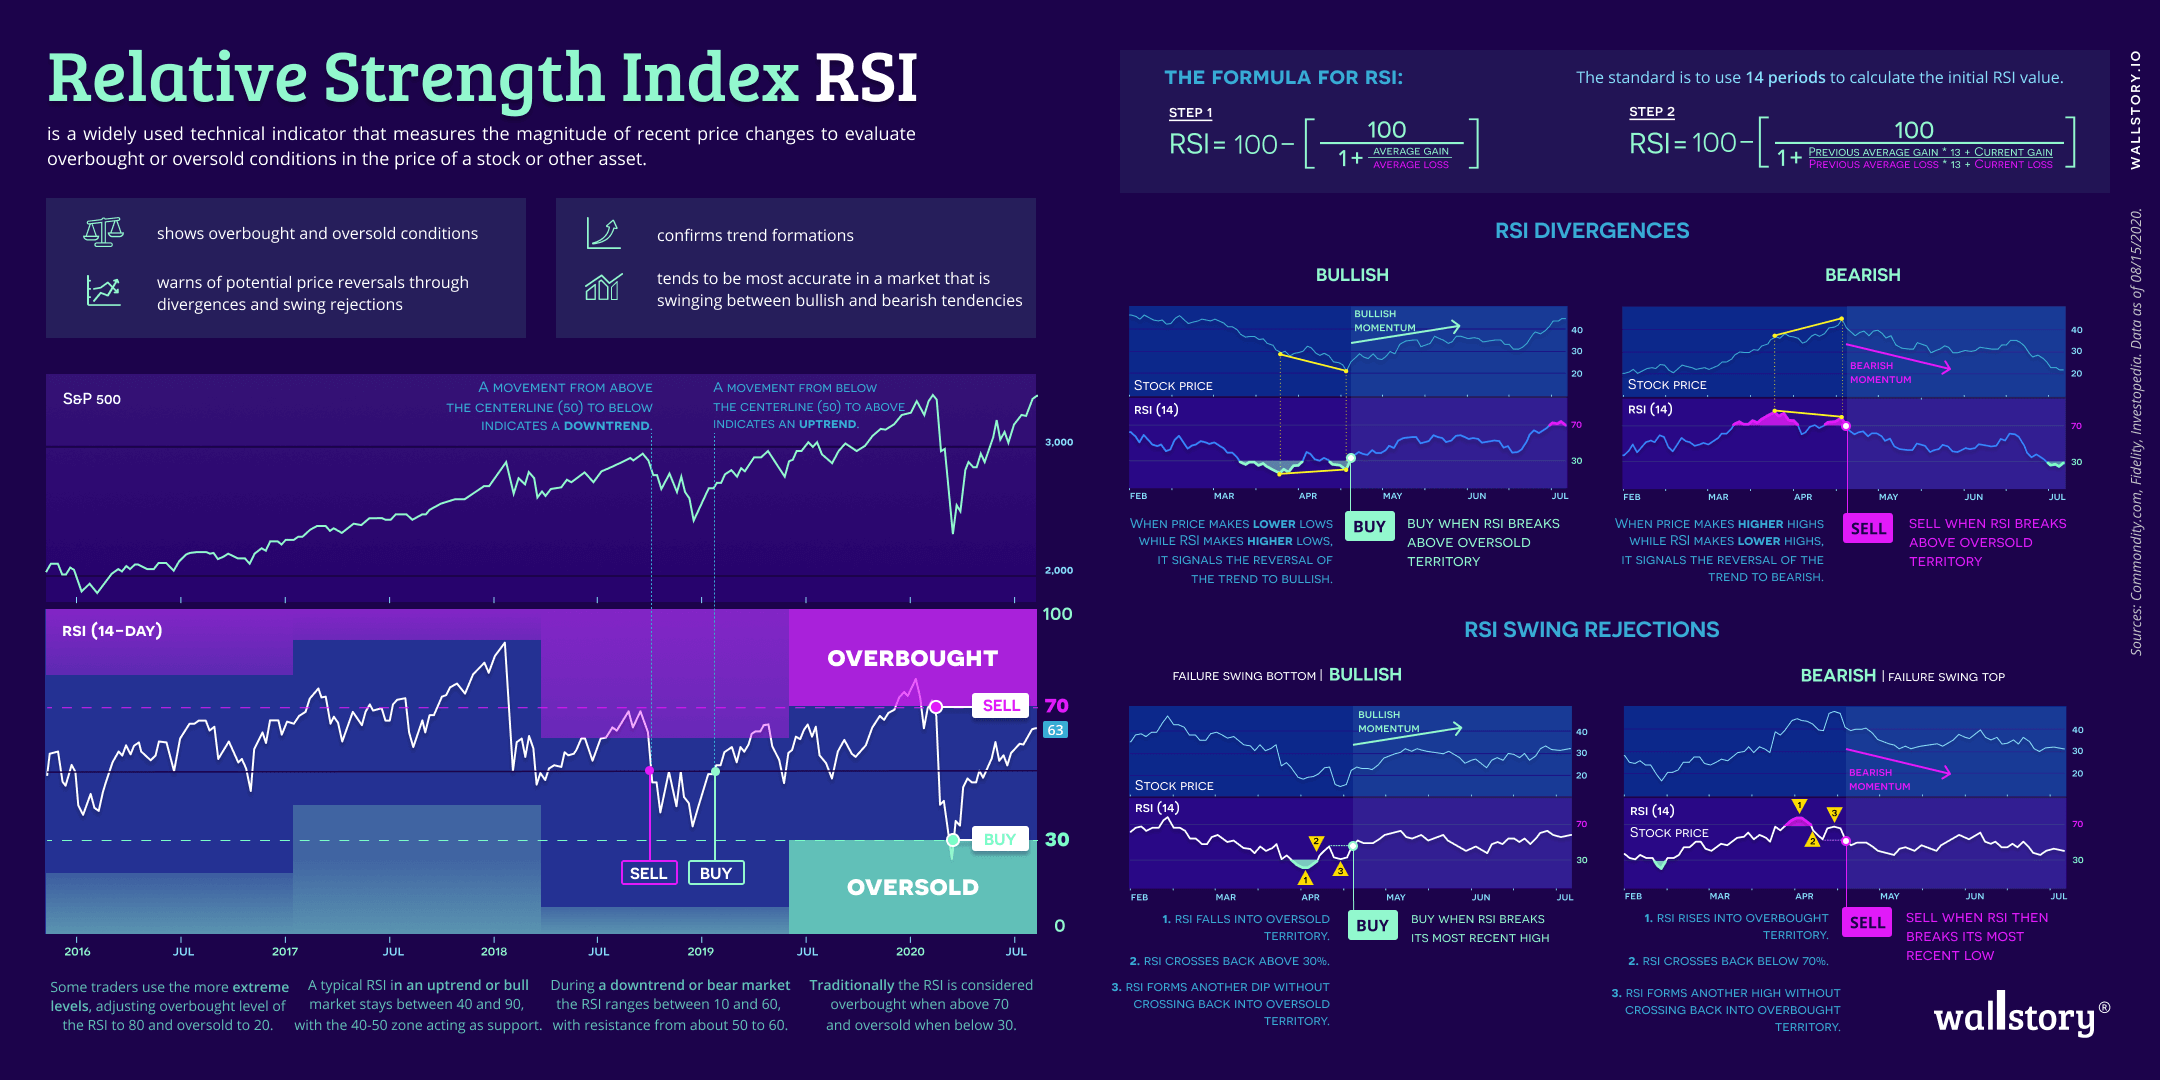
The Relative Strength Index (RSI) is a technical indicator used in stock market analysis and financial trading to measure the strength of a stock's price action. It is a momentum oscillator that compares the magnitude of a stock's recent gains to the magnitude of its recent losses, with the goal of determining overbought and oversold conditions in the stock's price. The RSI is calculated using a formula that takes into account the average gains and losses of a stock over a specified number of periods (usually 14). The RSI is plotted on a scale of 0 to 100, with values above 70 typically indicating that a stock is overbought (i.e., its price has risen too quickly and may be due for a correction), and values below 30 indicating that a stock is oversold (i.e., its price has fallen too quickly and may be due for a rebound). The RSI is used by traders and investors to help identify potential buy and sell signals, and to confirm trends and trend reversals. It is important to note, however, that the RSI is just one of many technical indicators and should not be used in isolation when making investment decisions. It should be used in conjunction with other technical analysis tools and with fundamental analysis of a company's financials, management, and market position.


