Golden cross
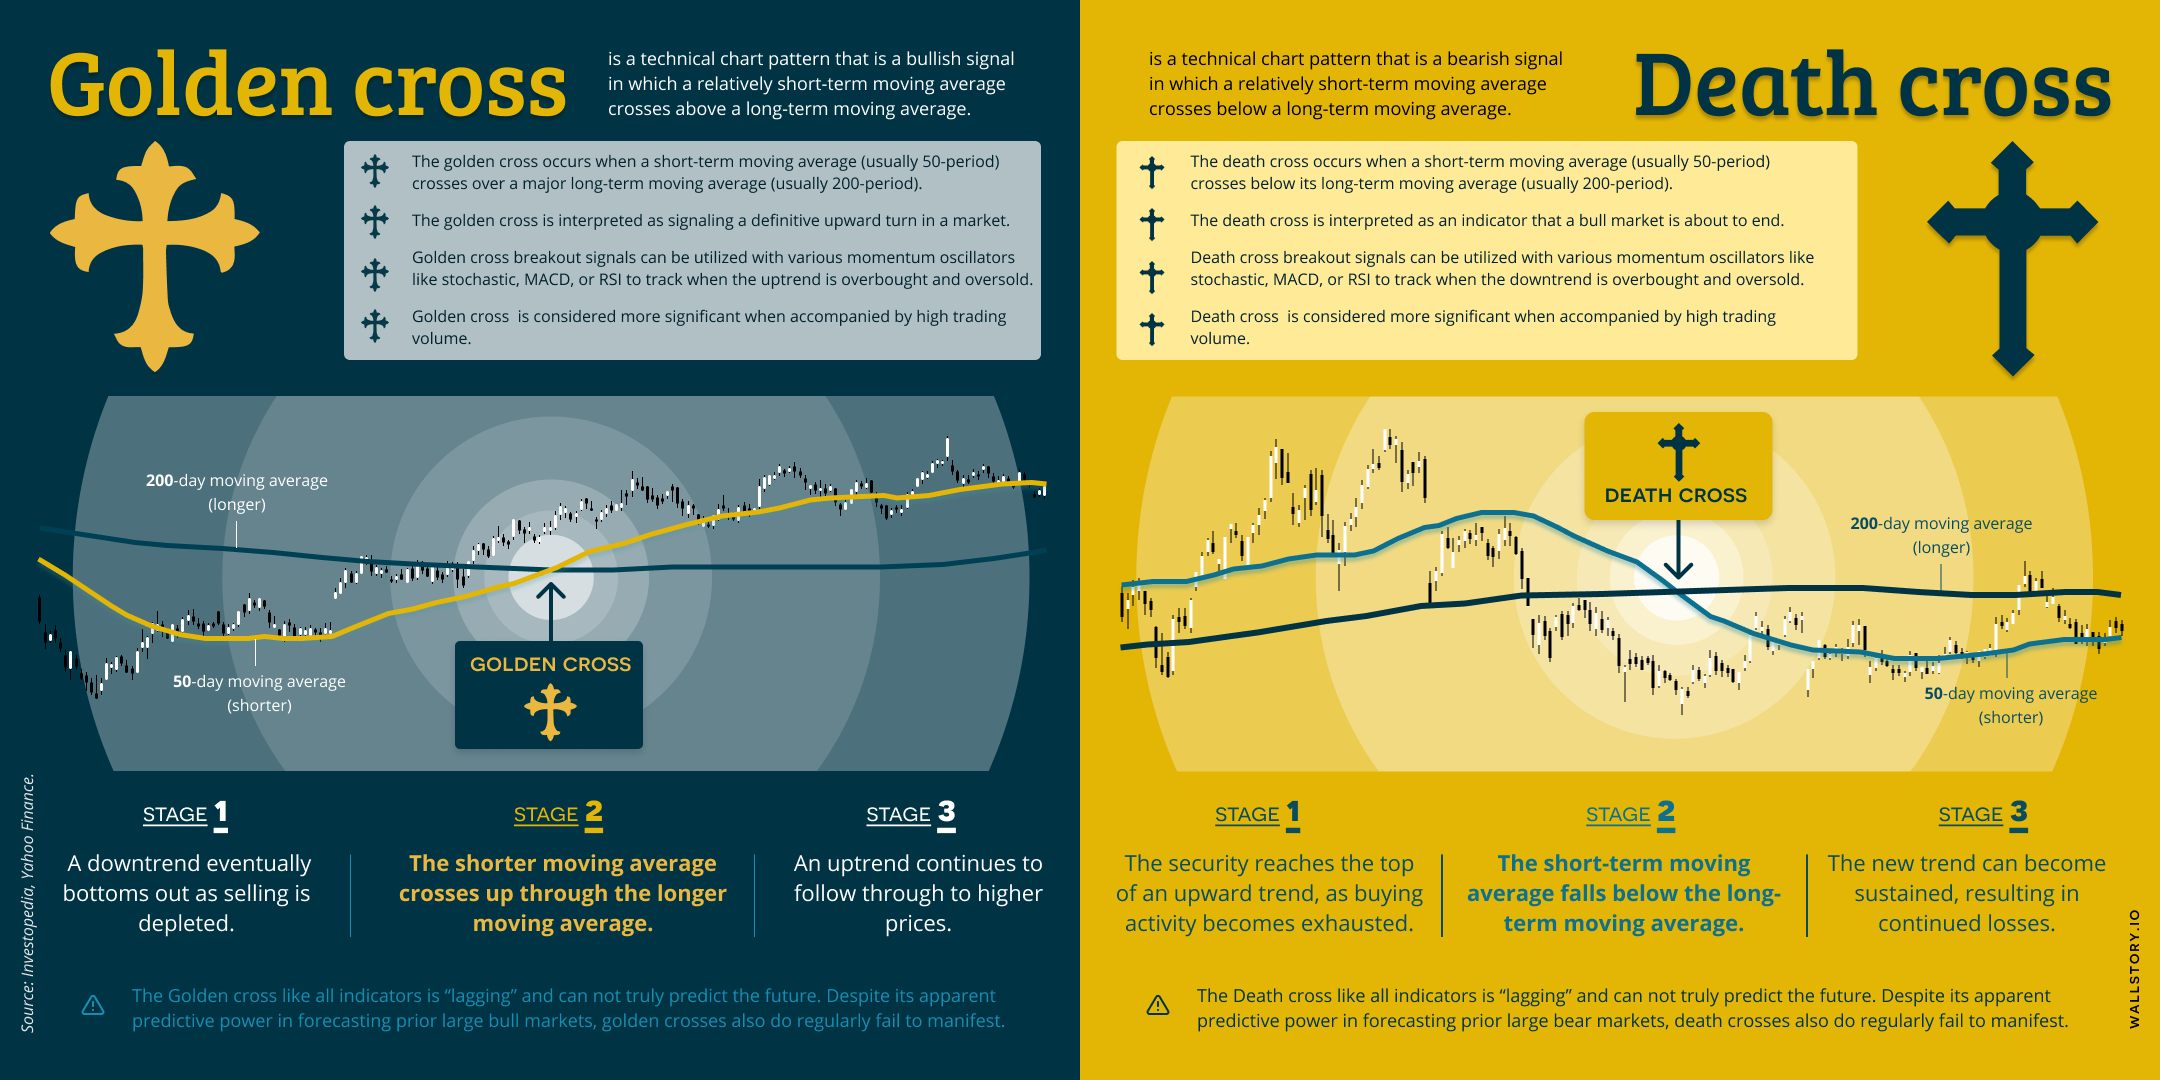
The golden cross is a bullish technical chart pattern that occurs when a stock's short-term moving average (such as a 50-day moving average) crosses above its long-term moving average (such as a 200-day moving average). This crossover is considered a bullish signal and is interpreted as an indication that the stock's trend is shifting from a downtrend to an uptrend.